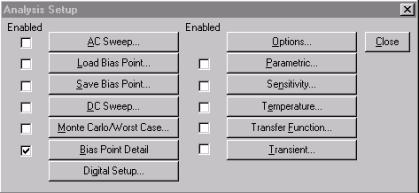
Analysis Setup
|
|
Select Analysis/Setup or click on the setup analysis icon to setup analysis. Analysis setup window will display. |
|
|
|
|
DC Analysis (Bias Point Detail) |
DC currents and voltages are automatically calculated. It is default. |
|
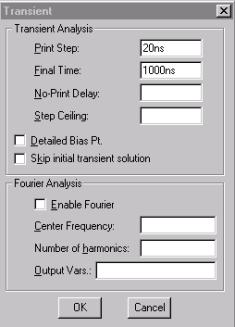
Transient Analysis (Transient) |
Transient analysis determines the output with respect to time.
|
|
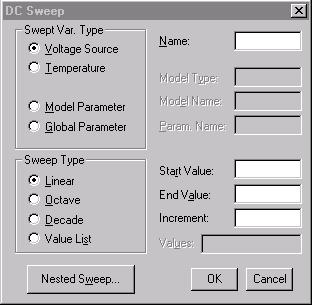
DC Sweep |
Change one or more DC voltage source at the same time. The output is with respect to the source being swept.
|
|
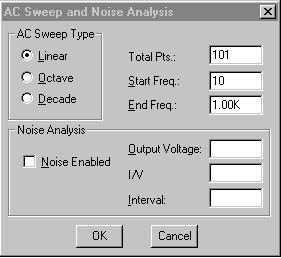
AC Sweep Analysis |
AC Sweep Analysis determines the output with respect to the frequency.
|
|
Monte Carlo/Worst Case Analysis |
Determines the output affected from the tolerances of the components. |
RUNNING SIMULATION
|
|
Select Analysis/Simulate [F11] or click on the simulate icon to run simulation. After simulation, the DC values of voltage and current can be displayed when using DC bias point analysis. And the Probe will automatically open and all of the value of marker will appear on the plot. Message window will automatically open during simulation. |
Viewing Results
MicroSim Probe is the waveform analyzer for Pspice simulations. In Probe, you can visually analyze and interactively manipulate the waveform data produced by circuit simulation.
· Traces to the plot from marker
When voltage or current markers were marked in the schematic, the plot will automatically display.
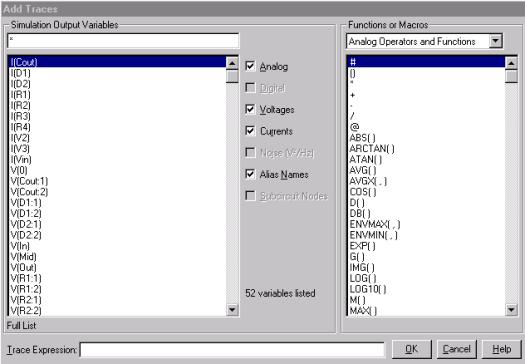
· Add Additional Traces to the plot
Select Trace/Add [Insert] to add new traces.
Then choose from the left column
or in the Trace Expression, type name of the expression.
· Add an Additional Plot
Select Plot/Add Plot to add a new plot.
· Add a Title to the Plot
Select Edit/Modify Title to modify the title.
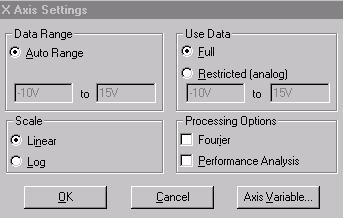
· Change Axis Settings
Select Plot/Y-Axis settings or double-click on the y-axis to change the Y-Axis settings.
Select Plot/X-Axis settings or double-click on the x-axis to change the X-Axis settings.
· Add a Text Labels
Select Tools/Label/Text to add text label.
· Add probe cursors
Select Tools/Cursor/Display to add cursors on the plot.
A probe cursor box will appear. Coordinates of cursor will display.
· Split two probe cursor (A1, A2)
One cursor is selected by left mouse button and the other cursor is selected by right mouse button.
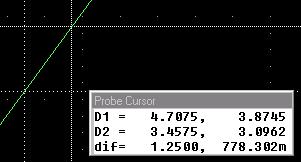
· Label a probe cursor coordinates
Using left mouse button or right mouse button to select the cursor,
Select Tools/label/Mark to label the cursor coordinates directly.