Correspondence-Free Multi-Camera Activity Analysis amd Scene Modeling
Introduction
We propose a novel approach for activity analysis in multiple synchronized but uncalibrated static camera views. We assume that the topology of cameras is unknown and quite arbitrary, the fields of views covered by these cameras may have no overlap or any amount of overlap, and objects may move on different ground planes. Using low-level cues, objects are first tracked in each of the camera views independently, and the positions and velocities of objects along trajectories are computed as features. Under a generative model, our approach jointly learns the distribution of an activity in the feature spaces of different camera views. Then it accomplishes the following tasks: (1) grouping trajectories, which may be in different cameras views but belong to the same activity, into one cluster; (2) modeling paths commonly taken by objects across multiple camera views; (3) detect abnormal activities. To the best of our knowledge, no prior result of co-clustering trajectories in multiple camera views has been published. Advantages of this approach are that it does not require first solving the challenging correspondence problem, and the learning is unsupervised. Our approach is evaluated on two very large real data sets, each of which have four cameras. The views and topology of these cameras are shown in Figure 1. A detailed description of this work can be found in [1] [2]
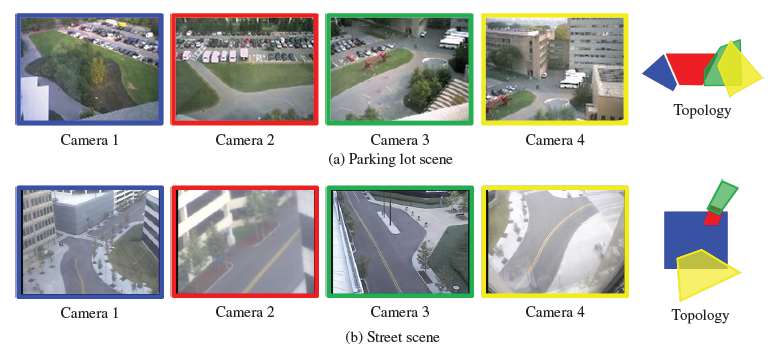
Figure 1. Views and topology of cameras in two data sets, a parking lot scene and a street scene. When the topology of camera views is plotted, the fields of camera views are represented by different colors: blue (camera 1), red (camera 2), green (camera 3), yellow (camera 4). However, our approach does not require knowledge of the topology of the cameras in advance.
Our Approach
Objects are first tracked in each of the camera views independently. The locations and moving directions of points on the trajectories are extracted as features. Then a track network is built as shown in Figure 2. Each node on the network is a trajectory. If two trajectories are in different camera views, and their temporal extents are close (their gap is less than T), they are connected by an edge. There is no edge connecting two tracks in the same camera views. Here we assume that when an object exist from a camera view, it is already in one of other camera views, or will enter into one of other camera views within time T, i.e. the transition gap is smaller than T. There is no other topology and geometry constraint. Then a generate model, in which a activity is model as a joint distribution over the feature spaces (location + moving drection) of multiple camera views, is built. A trajectory is treated as a set of points that belong to different activities. If two trajectories are connected by an edge on the network, it is more likely for them to belong to the same object and thus our model require them to have similar distributions over activities, compared with other tracks not connected.
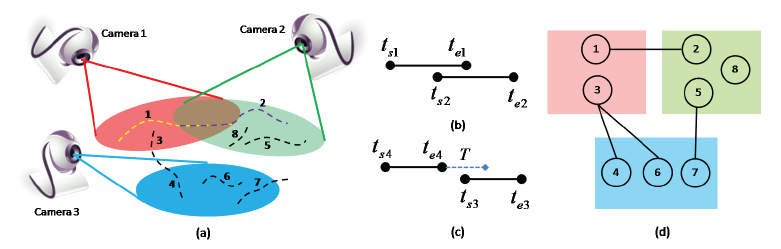
Figure 2. An example of building a network connecting trajectories in multiple cameras. (a) Trajectories in three camera views. (b) The temproal extents of trajectories 1 and 2. (c) The temporal extents of trajectories 3 and 4. (d) The network connecting trajectories.
Results on the Parking Lot Scene
The topology of its four cameras views is shown in Figure 1 (a). The view of camera 1 has no overlap with other camera views. However, the gap between views of cameras 1 and 2 is small. The views of cameras 2 and 3 have small overlap. The views of cameras 3 and 4 have large overlap. 14 activities are learnt from the parking lot scene. They are shown in Figure 3. Activity 1 is vehicles and pedestrians entering the parking lot. It has a large extent in space and is observed by all of the four cameras. Activity 4 is vehicles and pedestrians leaving the parking lot. In activities 5 and 7 , pedestrians are walking in the same direction but on different paths. From the distributions of their models, it is observed that the two paths are side by side but well separated in space. The path of activity 6 occupies almost the same region as that of activity 5. However, pedestrians are moving in opposite directions in these two activities, so the distributions of their models are plotted in different colors. In activity 11, pedestrians appear from the behind trees and a building as observed by cameras 3 and 4 and disappear from a gate of the parking lot in the view of camera 2.
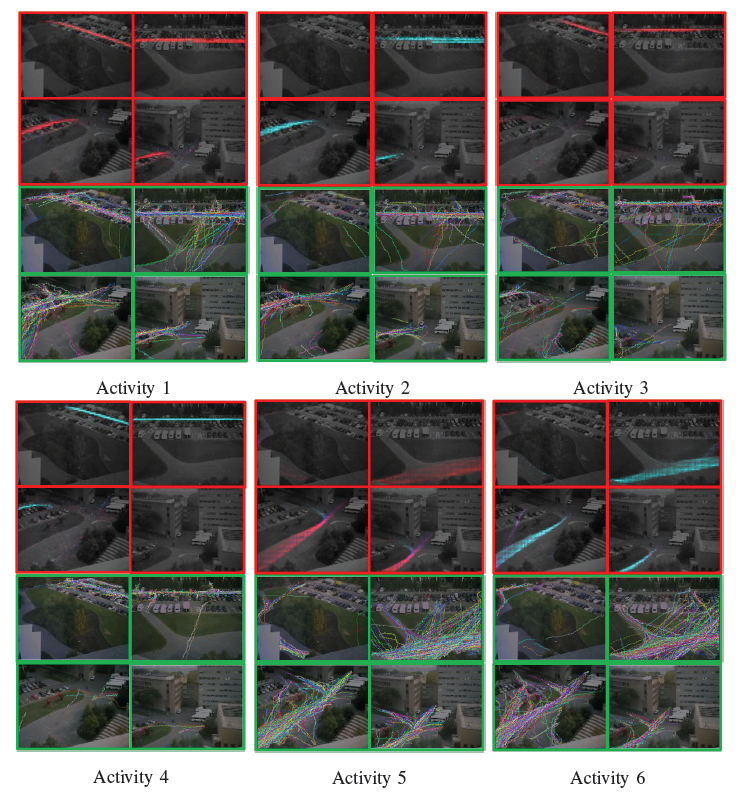
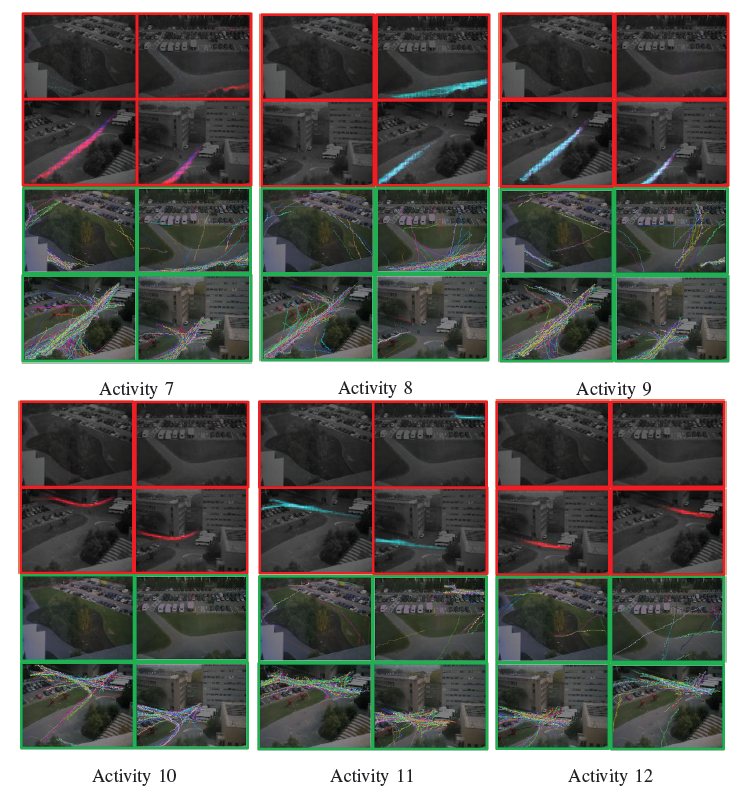
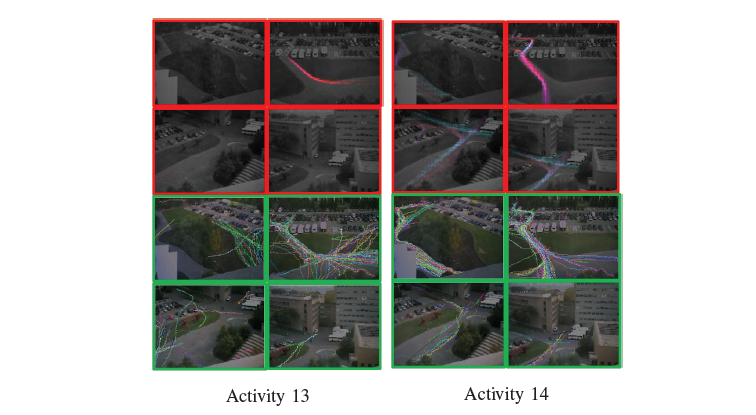
Figure 3. Distributions of activity models and clusters of trajectories of the parking lot scene. When plotting the distributions of activity models (in the four red windows on the top), different colors are used represent different moving directions. When plotting trajectories clustered into different activities (in the four green windows at the bottom), random colors are used to distinguish individual trajectories.
Results on the Street Scene
The topology of the four cameras of the street scene is shown in Figure 1 (b). Camera 1 has a distant view of the street. Camera 2 zooms in on the top-right part in the view of camera 1. The view of camera 3 has little overlap with the views of cameras 1 and 2. It extends the top-right part of the view in camera 1 along the street. Seventeen activities are learnt in this scene. They are shown in Figure 4. Activity 1 is vehicles moving on the road. It is observed by all four cameras. Vehicles first move from the top-right corner to the bottom-left corner of the view in camera 4. Then they enter the bottom region of the view in camera 1 and move upward. Some vehicles disappear at the exit points observed in the views of cameras 2 and 3, and some move further beyond the view of camera 3. In activities 5, 9, and 10, pedestrians first walk along the sidewalk in the view of camera 1, and then cross the street as observed by camera 4. The paths of activities 9 and 10 occupy similar regions in the view of camera 1, but their paths diverge in the view of camera 4.
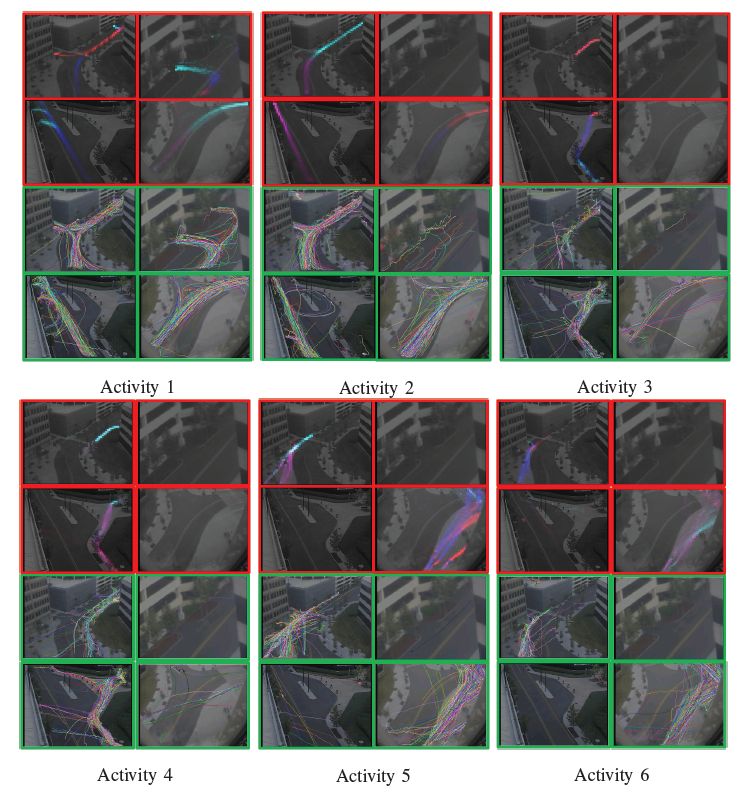
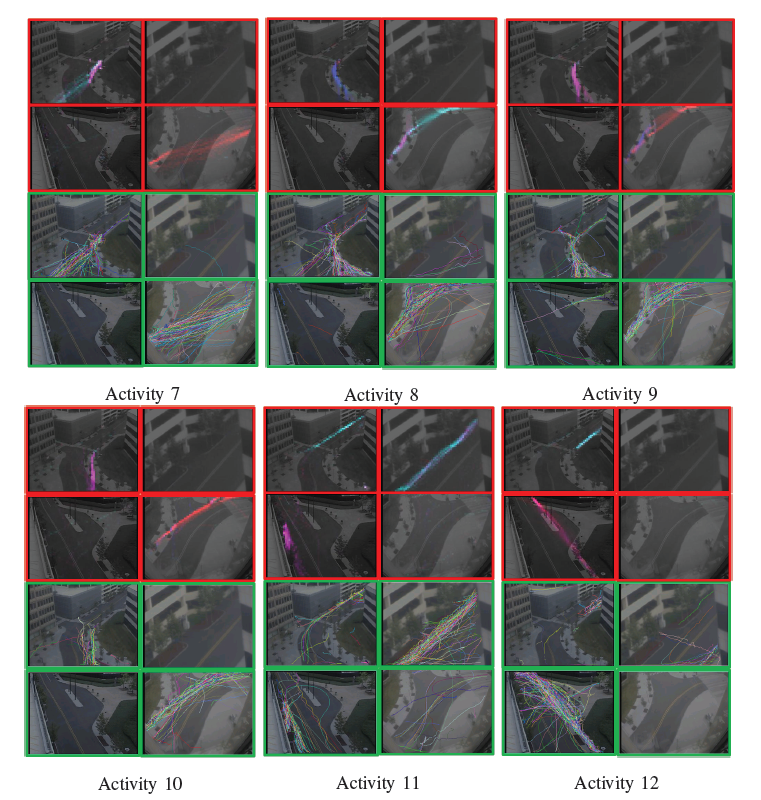
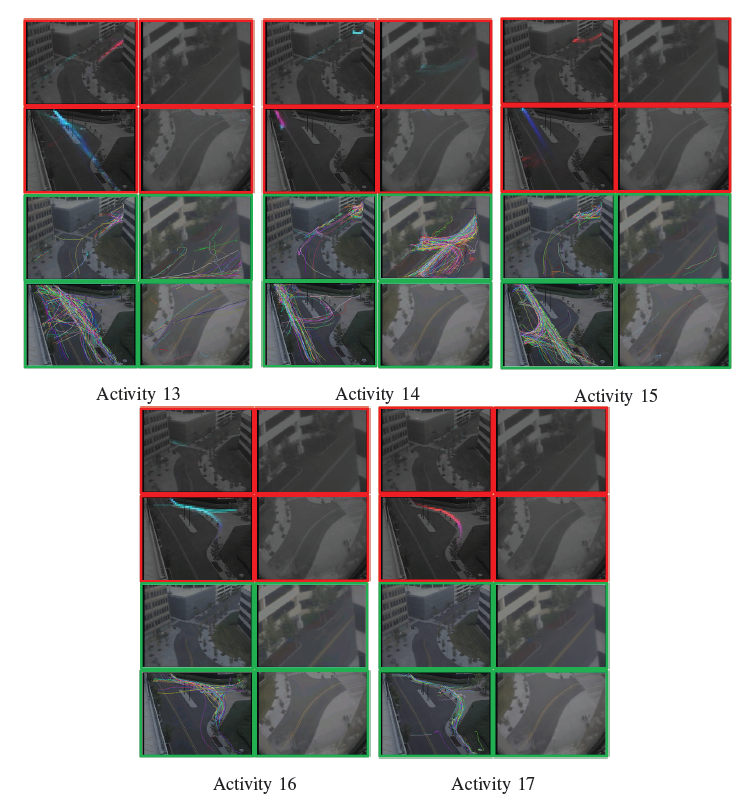
Figure 4. Distributions of activity models and clusters of trajectories of the street scene. When plotting the distributions of activity models (in the four red windows on the top), different colors are used represent different moving directions. When plotting trajectories clustered into different activities (in the four green windows at the bottom), random colors are used to distinguish individual trajectories.
[1] X. Wang, K. Tieu, and E. Grimson, “Correspondence‐Free Multi‐Camera Activity Analysis and Scene Modeling,” in Proceedings of IEEE Computer Society Conference on Computer Vision and Patter Recognition (CVPR) 2008. [PDF]
[2] X. Wang, K. Tieu, and E. Grimson, “Correspondence‐Free Multi‐Camera Activity Analysis and Scene Modeling,” accepted to IEEE Transactions on Pattern Analysis and Machine Intelligence. [PDF]